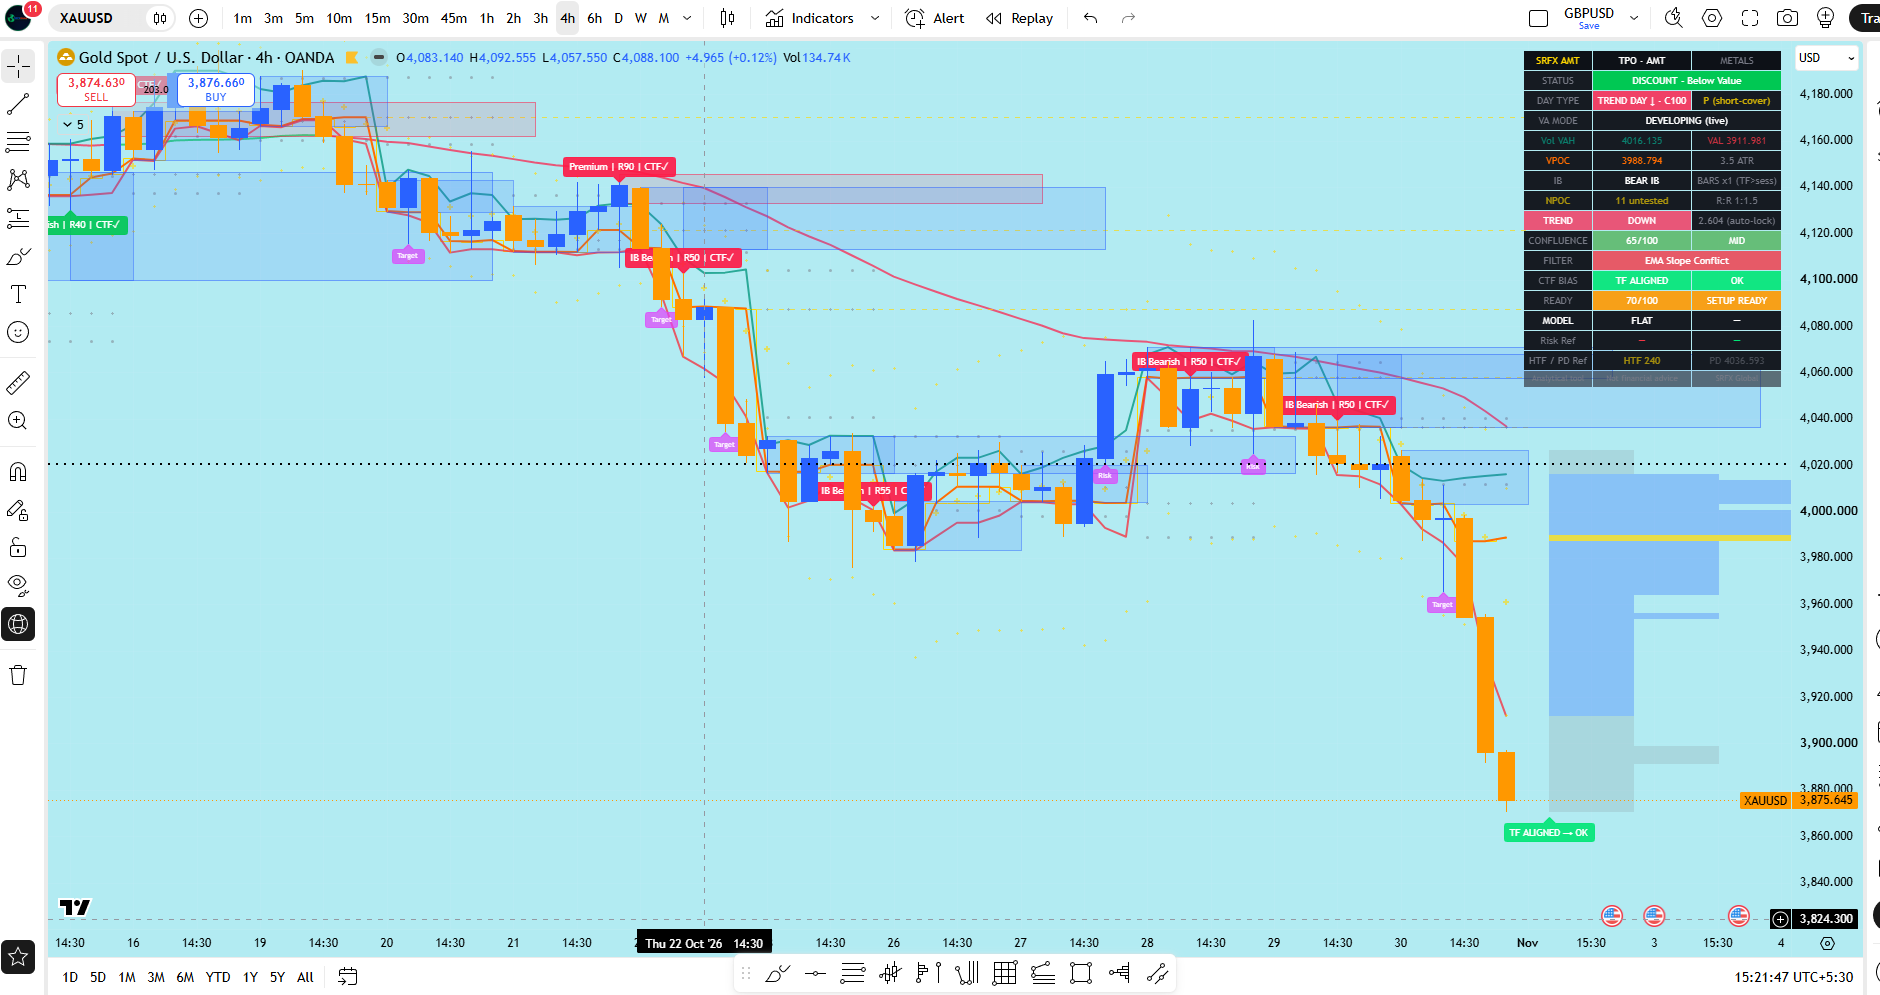
The tool is designed to help traders study where price is trading relative to developing value, previous value, Initial Balance, point of control, and higher-timeframe context. It is not intended to predict future price movement or provide guaranteed trade entries. The purpose is to organize auction-market information into a clearer visual framework so that users can make their own decisions with additional context.
This script is an educational and analytical tool only. It is not financial advice, investment advice, or a complete trading system.
CORE CONCEPT
Markets often rotate between areas of value, move away from balance, revisit previous acceptance levels, or build new value at higher or lower prices. Auction Market Pro helps visualize this process by combining:
• Developing value area levels
• Volume Point of Control and TPO Point of Control
• Initial Balance range
• Previous-day value references
• Naked POC tracking
• Day-type classification
• Higher-timeframe guide levels
• Cross-timeframe conflict detection
• Optional analytical model signals
• Structured and human-readable alerts
The script does not claim that any level will hold, break, or produce a profitable outcome. These references are intended to support observation, planning, and review.
MAIN FEATURES
1. TPO + Volume Profile Engine
The script builds an intraday profile using a rebuild-based binning engine. It stores each bar’s high, low, and volume, then maps that activity into profile rows. Bar volume is distributed evenly across the rows covered by that bar.
The profile engine is designed to maintain consistency when the day expands beyond the original range. If the day low extends below the current anchor or the row capacity needs to grow, the profile is rebuilt using the stored intraday data.
Displayed profile references include:
• TPO Point of Control
• Volume Point of Control
• Developing Value Area High
• Developing Value Area Low
• Previous-day VAH / VAL / POC
• Optional TPO histogram
• Optional volume histogram
Fast Mode is included for lower timeframes. Fast Mode can defer profile scans for performance, but the script still stores all bar data so the profile does not intentionally skip data.
2. Value Area and Market Location
The dashboard identifies whether price is currently trading:
• Above value / Premium
• Below value / Discount
• Inside value / Fair Value
This helps users quickly understand whether price is outside the current value area or rotating inside it.
The dashboard status row uses the developing profile so that users can see the current live profile state. Signal-related logic can optionally use settled value levels, depending on the selected mode.
3. Settled Value Area Mode
Settled VA Mode allows the script to lock signal reference levels when the Initial Balance completes.
When this mode is enabled:
• VAH, VAL, and POC used by the analytical model are snapshotted at IB completion
• Displayed profile levels continue developing normally
• Signal logic waits until the value area is settled
• Webhook data remains consistent with the signal frame
This mode is useful for users who prefer fixed post-IB reference levels instead of constantly shifting intraday signal levels.
4. Initial Balance Presets
The script includes several Initial Balance options:
• AUTO
• London 0800–0900
• New York 0930–1030
• Bar Count
• Custom Session
AUTO mode adapts by market type. For metals and forex, it uses a London-style IB by default. For 24-hour markets, it can use bar-count mode.
On chart timeframes above 1 hour, one-hour session windows may not match cleanly. To avoid silent IB failure, preset session modes automatically fall back to a bar-count IB on higher timeframes. The fallback bar count is scaled so that higher-timeframe charts do not create an excessively long Initial Balance.
The dashboard shows the active IB mode so users can understand which method is being used.
5. Day Type Classification
After the Initial Balance completes, the script classifies the developing session using range extension and profile-shape behaviour.
Possible day types include:
• Normal Day
• Normal Variation Day
• Trend Day
• Neutral Day
• Double Distribution Day
The script also classifies profile shape:
• P-shape: often associated with short-covering style profile development
• b-shape: often associated with long-liquidation style profile development
• D-shape: often associated with balanced or rotational development
A developing confidence score is shown with the day type. This is important because intraday day-type classification can change as the session develops. The confidence score is intended to remind users that early-session classification is provisional and should not be treated as a fixed prediction.
Double Distribution sensitivity can be adjusted:
• Conservative
• Balanced
• Aggressive
This allows users to adapt the classification to different instruments and data feeds.
6. Naked POC Tracking
The script can track prior-day POCs that have not yet been revisited by price. These are displayed as Naked POC reference levels.
When price trades through a tracked Naked POC, the line is removed automatically and an optional alert event can be triggered.
Naked POCs are included as historical acceptance references only. They should not be treated as guaranteed targets or guaranteed reaction zones.
7. Higher-Timeframe Guide and Cross-Timeframe Conflict
The script includes a higher-timeframe guide based on confirmed higher-timeframe data. The design intentionally uses confirmed higher-timeframe values, which means the guide can lag by one higher-timeframe bar.
This is intentional and helps avoid using unfinished higher-timeframe values.
The script can also detect basic cross-timeframe conflict between local EMA slope and higher-timeframe EMA slope. When conflict appears, the chart can display a warning label such as:
• HTF Bull / LTF Bear
• HTF Bear / LTF Bull
• TF Aligned
• No Bias
This is intended as context only, not as a trade instruction.
8. Analytical Model Signals
The script includes optional analytical model signals based on:
• Discount model: price crossing below VAL
• Premium model: price crossing above VAH
• Initial Balance breakout model
• EMA slope filter
• Minimum ATR distance filter
• Optional HTF filter
• Optional fair-value block
• Optional choppy-value-area filter
• Optional Ready Score gate
• Re-entry control while a model is active
These signals are not financial advice and are not designed to be used blindly. They are analytical markers that show where the script’s conditions were met.
The signal model includes projected Risk and Target references for analysis and review. These references are educational planning levels only. They do not guarantee execution quality, win rate, or profitability.
9. Readiness and Confluence Scoring
The dashboard includes a readiness score and confluence score. These scores are rule-based summaries of the active filters and conditions, such as:
• Market location relative to value
• EMA slope agreement
• ATR distance
• Cross-timeframe state
• IB context
• Filter status
Scores are intended to help users compare setup quality inside the script’s own framework. They should not be interpreted as probability of profit.
10. Unified Alert System
The script includes a unified alert() event system.
Users can create one TradingView alert using:
Any alert() function call
From there, enabled events can fire through the same alert setup.
The script supports two message formats:
Human Readable:
A clean notification-style format for manual review.
Structured (Bot Webhook):
A pipe-delimited schema intended for automation or external parser workflows.
Structured messages can include fields such as:
• Signal direction
• Model type
• Risk reference
• Target reference
• Zone
• VAH / VAL / VPOC
• Confluence score
• Readiness score
• Readiness tier
• Cross-timeframe state
• VA mode
• Day type
• Profile shape
• Day-type confidence
• IB mode
• Reason chain
Optional alert events include:
• Model signal
• Model exit
• Naked POC fill
• Cross-timeframe conflict
Traditional alertcondition() entries are also included for users who prefer creating separate alerts by type.
IMPORTANT NOTES
This script is not a strategy and does not place trades.
It does not provide guaranteed buy or sell signals.
It does not guarantee accuracy, win rate, risk-reward results, or future performance.
It should not be used as the only basis for trading decisions.
Auction-market levels can fail, shift, or become invalid as new market information develops.
Day-type classification is developing information and may change throughout the session.
Higher-timeframe guide values are based on confirmed data and may lag by design.
Users should apply their own analysis, risk management, and judgment before making any trading decision.
BEST USED FOR
• Auction Market Theory study
• TPO and value-area analysis
• Intraday profile development review
• Initial Balance analysis
• Previous-day value reference tracking
• Naked POC observation
• Day-type study
• Market-location context
• Confluence review
• Alert-based workflow organization
DISCLAIMER
Auction Market Pro [TPO & AMT] is provided for educational and analytical purposes only. It is not financial advice, investment advice, or a recommendation to buy or sell any financial instrument. Trading involves risk, and past market behaviour does not guarantee future results. Users are responsible for their own decisions, risk management, and trade execution.